Through Excel PivotCharts, data was automatically visualized through a bar chart. It made comparing multiple data sets of numerical values convenient, but that was about all it did. I wish there was support for something like a pie chart, where you would just put in a single field and Excel would get the percentage of times a certain value was repeated compared to others. This also doesn’t take into account data types that are not numeric.
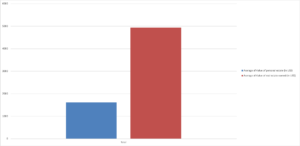
Additionally, because the scale and axes of the graph are automatically generated, this creates distortion in how values are perceived based on size. An obvious example is the tutorial with this data set that compared average male and female householder ages. The graph displayed bars with the male ages being twice the size as the female ages, leading one to believe that there was a massive difference. In actuality, the difference was only about 3 years. This is actually something I’ve noticed across data presentation as a whole. A lot of people are not careful about how they create their graphs, or they are intentionally creating graphs with correct information but misleading presentation.
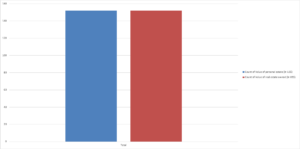
It was very hard to create a graph that the PivotChart actually wanted to give me information for, mainly for the reasons I listed above. But I was able to generate this graph of average value of personal estates vs. real estates. Interestingly, Excel defaulted to counts of the amount of cels with values in them rather than sums like it did before (possibly because of some inconsistent labeling of cels where no data was available). I didn’t notice this at first and assumed I was looking at counts, so the difference in the visual of the two graphs caught me off guard at first, because I wasn’t such a drastic change.